Chủ đề nóng: Phương pháp kỷ luật tích cực - Cổ học tinh hoa - Những thói hư tật xấu của người Việt - Công lý: Việc đúng nên làm - Giáo án Điện tử - Sách giáo khoa - Học tiếng Anh - Bài giảng trực tuyến - Món ăn bài thuốc - Chăm sóc bà bầu - Môi trường - Tiết kiệm điện - Nhi khoa - Ung thư - Tác hại của thuốc lá - Các kỹ thuật dạy học tích cực
- Dạy học phát triển năng lực - Chương trình giáo dục phổ thông
Lecture:Phân loại học phân tử/Nhóm 3
Từ VLOS
| Danh sách học viên theo nhóm 3 | |
|
3.1
Bùi
Văn
Hiệu 3.6 Nguyễn Ngọc Lương (hoạt động, nhắn tin) 3.2 Nguyễn Trường Khoa (hoạt động, nhắn tin) 3.3 Trịnh Diệu Linh (hoạt động, nhắn tin) |
|
| Portal: Giới thiệu - Nhiệm vụ - Tài liệu - Thời gian biểu - Bài tập - Blog - Giảng đường chung - Phòng họp nhóm: 1, 2, 3 - tất cả | |
Bản lưu của nhóm[sửa]
Bài 4[sửa]
1. Kiểm tra disimilarity matrix:
Sử dụng APE library:
#Analysis the aligment with APE library:
rm(list = ls());
library(ape);
#Read the aligned sequences:
ALIGN = read.dna("16S.all.0.clustalw", format = "clustal");
#Calculate the distance matrix:

allmethod = c("raw","JC69","K80","F81","K81","F84","BH87","T92","TN93","GG95","logdet","paralin");
nmethod = length(allmethod);
nSpecies = 98;
speciesTable = array(0,c(nSpecies,nmethod+1));
colnames(speciesTable) = c("Number",allmethod);
for (kmethod in 1:nmethod)
{
	method = allmethod[kmethod];
	sdist = dist.dna(ALIGN, model = method);
	#Plot the tree:
	#dev.new();
	#plot(hclust(sdist));

	sdist = as.matrix(sdist);
	#Change the rownames:
	allID = rownames(sdist);
	nallID = length(allID);
	for (kID in 1:nallID)
	{
		ID = allID[kID];
		ID = strsplit(ID,split = "\\|")[[1]][1];
		allID[kID] = ID;
	};
	rownames(sdist) = allID;
	#Load the annotation:
	allInfo = read.table("16S.annotation.txt", colClass = "character", header = FALSE, row.names = 1);
	allInfo = allInfo[allID,1];
	names(allInfo) = allID;
	#rownames(allInfo) = allID;
	#Take the species to be check:
	allSpecies = intersect(allInfo,allInfo)
	#nSpecies = length(allSpecies);

	rownames(speciesTable) = allSpecies;
	for (k in 1:nSpecies)
	{
		IDS = which(allInfo == allSpecies[k]);
		nIDS = length(IDS);
		mdist = sdist[IDS,IDS];

		speciesTable[k,1] = nIDS;
		if (nIDS > 1)
		{
			allValue = NULL;
			for (k1 in 1:nIDS)
			{
				for (k2 in k1:nIDS)
				{
					if (k2 != k1)
					{
						allValue = c(allValue,mdist[k1,k2]);
					};
				};
			};
			speciesTable[k,kmethod+1] = mean(allValue);
		};
	};
};
write.table(speciesTable, file = "table.txt", sep = "\t");
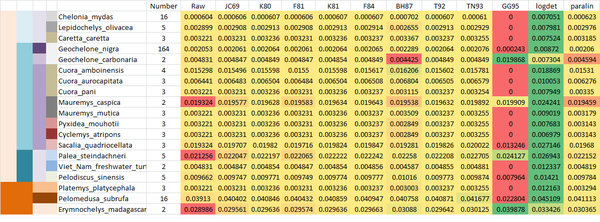
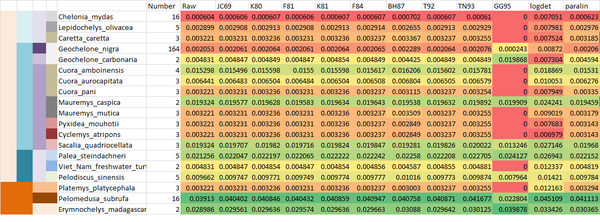
Output file (mở với excel, chế độ tab) [1] hoặc firefox [2].
Output file thu gọn (40 loài có nhiều hơn 1 trình tự.) [3]
Ghi chú về các giải thuật[sửa]
- Sequence alignment:
+ Một trong những yếu tố quan trong ảnh hưởng đến kết quả của alignment là chọn substitution matrix và gap punishment function (l). Hai cách xây dựng các substitution matrix là PAM và BLOSUM. Trong quá trình xây dựng người ta đã sử dụng Most Parsimony method đối với các blocks.
- Các mô hình tiến hóa: có nhiều vài mô hình tiến hóa như Jukes - Cantor, Kimura... về lý thuyết chỉ xoay quanh vấn đề dạng cụ thể của transition matrix, số lượng tham số của Markov process hoặc tính liên tục hoặc không liên tục của thời gian.
- Các giải thuật xây dựng phylotree.
- +Sau khi thực hiện mutiple alignment (dựa trên một substitution matrix và hàm phạt gap nhất định) việc tiếp theo ta phải đánh giá khoảng cách di truyền giữa các loài (tính bằng năm di truyền đến tổ tiên chung). Khoảng cách di truyền thường được thay thế bởi surrogate distance. Một trong đánh giá đơn giản nhất là dựa vào tỷ lệ aligned của hai sequence (việc này tương đương với dùng mô hình Jukes - Cantor.) Vì khoảng cách thay thế đó không thỏa mãn điều kiện ultrametric - đảm bảo cho cây di truyền được xây dựng là duy nhất nên cây thực tế thu được nói chung không duy nhất, mặc dù vẫn thực hiện được với các giải thuật ultrametric, Neighbor Joining.
- +Giải thuật xây dựng cây bằng Most Parsimony: Vét cạn tất cả các cây, với mỗi cây dùng giải thuật Fitch để tối ưu các trình tự của internal nodes sao cho số mismatch nhỏ nhất. (Lấy tổng theo tất cả các letter trong trình tự?) Cây minimum cost trong đó sẽ là cây được chọn. Ưu điểm của giải thuật này là không dựa vào mô hình tiến hóa cụ thể (?). Chỉ tối ưu hóa dạng topo. (Distance rút ra từ giải thuật này?)
- +Maximum Likelihood: Khác với Most Parsimony, ML tối ưu hóa cây trên tập vét cạn các cây đồng thời với độ dài của cành. Việc tính độ dài các cành đòi hỏi một mô hình tiến hóa để suy luận về thời gian (độ dài cành) nên phụ thuộc trực tiếp vào mô hình tiến hóa sử dụng. Từ cây sẽ rút trực tiếp ra distance.
- Vậy ba phương pháp không chỉ khác nhau về hình thức mà còn khác nhau về "bản chất."
Models[sửa]
Các models [4].
- raw, N: This is simply the proportion or the number of sites that differ between each pair of sequences. This may be useful to draw “saturation plots”. The options variance and gamma have no effect, but pairwise.deletion can.
- TS, TV: These are the numbers of transitions and transversions, respectively.
- JC69: This model was developed by Jukes and Cantor (1969). It assumes that all substitutions (i.e. a change of a base by another one) have the same probability. This probability is the same for all sites along the DNA sequence. This last assumption can be relaxed by assuming that the substition rate varies among site following a gamma distribution which parameter must be given by the user. By default, no gamma correction is applied. Another assumption is that the base frequencies are balanced and thus equal to 0.25.
- K80: The distance derived by Kimura (1980), sometimes referred to as “Kimura's 2-parameters distance”, has the same underlying assumptions than the Jukes–Cantor distance except that two kinds of substitutions are considered: transitions (A <-> G, C <-> T), and transversions (A <-> C, A <-> T, C <-> G, G <-> T). They are assumed to have different probabilities. A transition is the substitution of a purine (C, T) by another one, or the substitution of a pyrimidine (A, G) by another one. A transversion is the substitution of a purine by a pyrimidine, or vice-versa. Both transition and transversion rates are the same for all sites along the DNA sequence. Jin and Nei (1990) modified the Kimura model to allow for variation among sites following a gamma distribution. Like for the Jukes–Cantor model, the gamma parameter must be given by the user. By default, no gamma correction is applied.
- F81: Felsenstein (1981) generalized the Jukes–Cantor model by relaxing the assumption of equal base frequencies. The formulae used in this function were taken from McGuire et al. (1999).
- K81: Kimura (1981) generalized his model (Kimura 1980) by assuming different rates for two kinds of transversions: A <-> C and G <-> T on one side, and A <-> T and C <-> G on the other. This is what Kimura called his “three substitution types model” (3ST), and is sometimes referred to as “Kimura's 3-parameters distance”.
- F84: This model generalizes K80 by relaxing the assumption of equal base frequencies. It was first introduced by Felsenstein in 1984 in Phylip, and is fully described by Felsenstein and Churchill (1996). The formulae used in this function were taken from McGuire et al. (1999).
- BH87: Barry and Hartigan (1987) developed a distance based on the observed proportions of changes among the four bases. This distance is not symmetric.
- T92: Tamura (1992) generalized the Kimura model by relaxing the assumption of equal base frequencies. This is done by taking into account the bias in G+C content in the sequences. The substitution rates are assumed to be the same for all sites along the DNA sequence.
- TN93: Tamura and Nei (1993) developed a model which assumes distinct rates for both kinds of transition (A <-> G versus C <-> T), and transversions. The base frequencies are not assumed to be equal and are estimated from the data. A gamma correction of the inter-site variation in substitution rates is possible.
- GG95: Galtier and Gouy (1995) introduced a model where the G+C content may change through time. Different rates are assumed for transitons and transversions.
- logdet: The Log-Det distance, developed by Lockhart et al. (1994), is related to BH87. However, this distance is symmetric. Formulae from Gu and Li (1996) are used. dist.logdet in phangorn uses a different implementation that gives substantially different distances for low-diverging sequences.
- paralin: Lake (1994) developed the paralinear distance which can be viewed as another variant of the Barry–Hartigan distance.
<comments/>
Liên kết đến đây
- Portal: Rùa Hồ Gươm
- Lecture:Phân loại học phân tử
- Lecture:Phân loại học phân tử/Bài tập
- Lecture:Phân loại học phân tử/Tasks
- Lecture:Phân loại học phân tử/Tài liệu
- Lecture:Phân loại học phân tử/Thời gian biểu
- Lecture:Phân loại học phân tử/Nhóm 1
- Lecture:Phân loại học phân tử/Tasks/2
- Lecture:Phân loại học phân tử/Tasks/3
- Lecture:Phân loại học phân tử/Tasks/4
- Xem thêm liên kết đến trang này.


